In a new research report shared on X, Joe Consorti, Head of Growth at Theya, has dispelled ongoing rumors alleging that the Bitcoin price is being artificially held down. Consorti lays out a comprehensive examination of on-chain data, pointing to the normal cyclical behavior of long-term holders (LTHs) and their profit-taking patterns as key drivers of bitcoin’s current trading dynamic.
Is The Bitcoin Price Currently Manipulated?
One of the core arguments Consorti addresses is the suspicion that “the boring period of consolidation” might be engineered through hidden market forces. In his words: “Claims of artificial price suppression is a gold-era argument that doesn’t work in bitcoin, whose ledger is auditable in real time, meaning we can see exactly who is buying and selling through their own node on the network.”
Consorti underscores that any concerted effort to artificially cap Bitcoin would be visible to on-chain observers. Instead, the data points to a well-trodden pattern: after accumulating BTC in the lower price ranges—between $15,000 to $25,000—LTHs sell portions of their holdings into higher prices, redistributing coins to new market participants who continue bidding bitcoin upward. “This is normal. Those who held for years start offloading as price moves higher, transferring coins to new buyers stepping in to bid the price to even higher highs.”
Related Reading
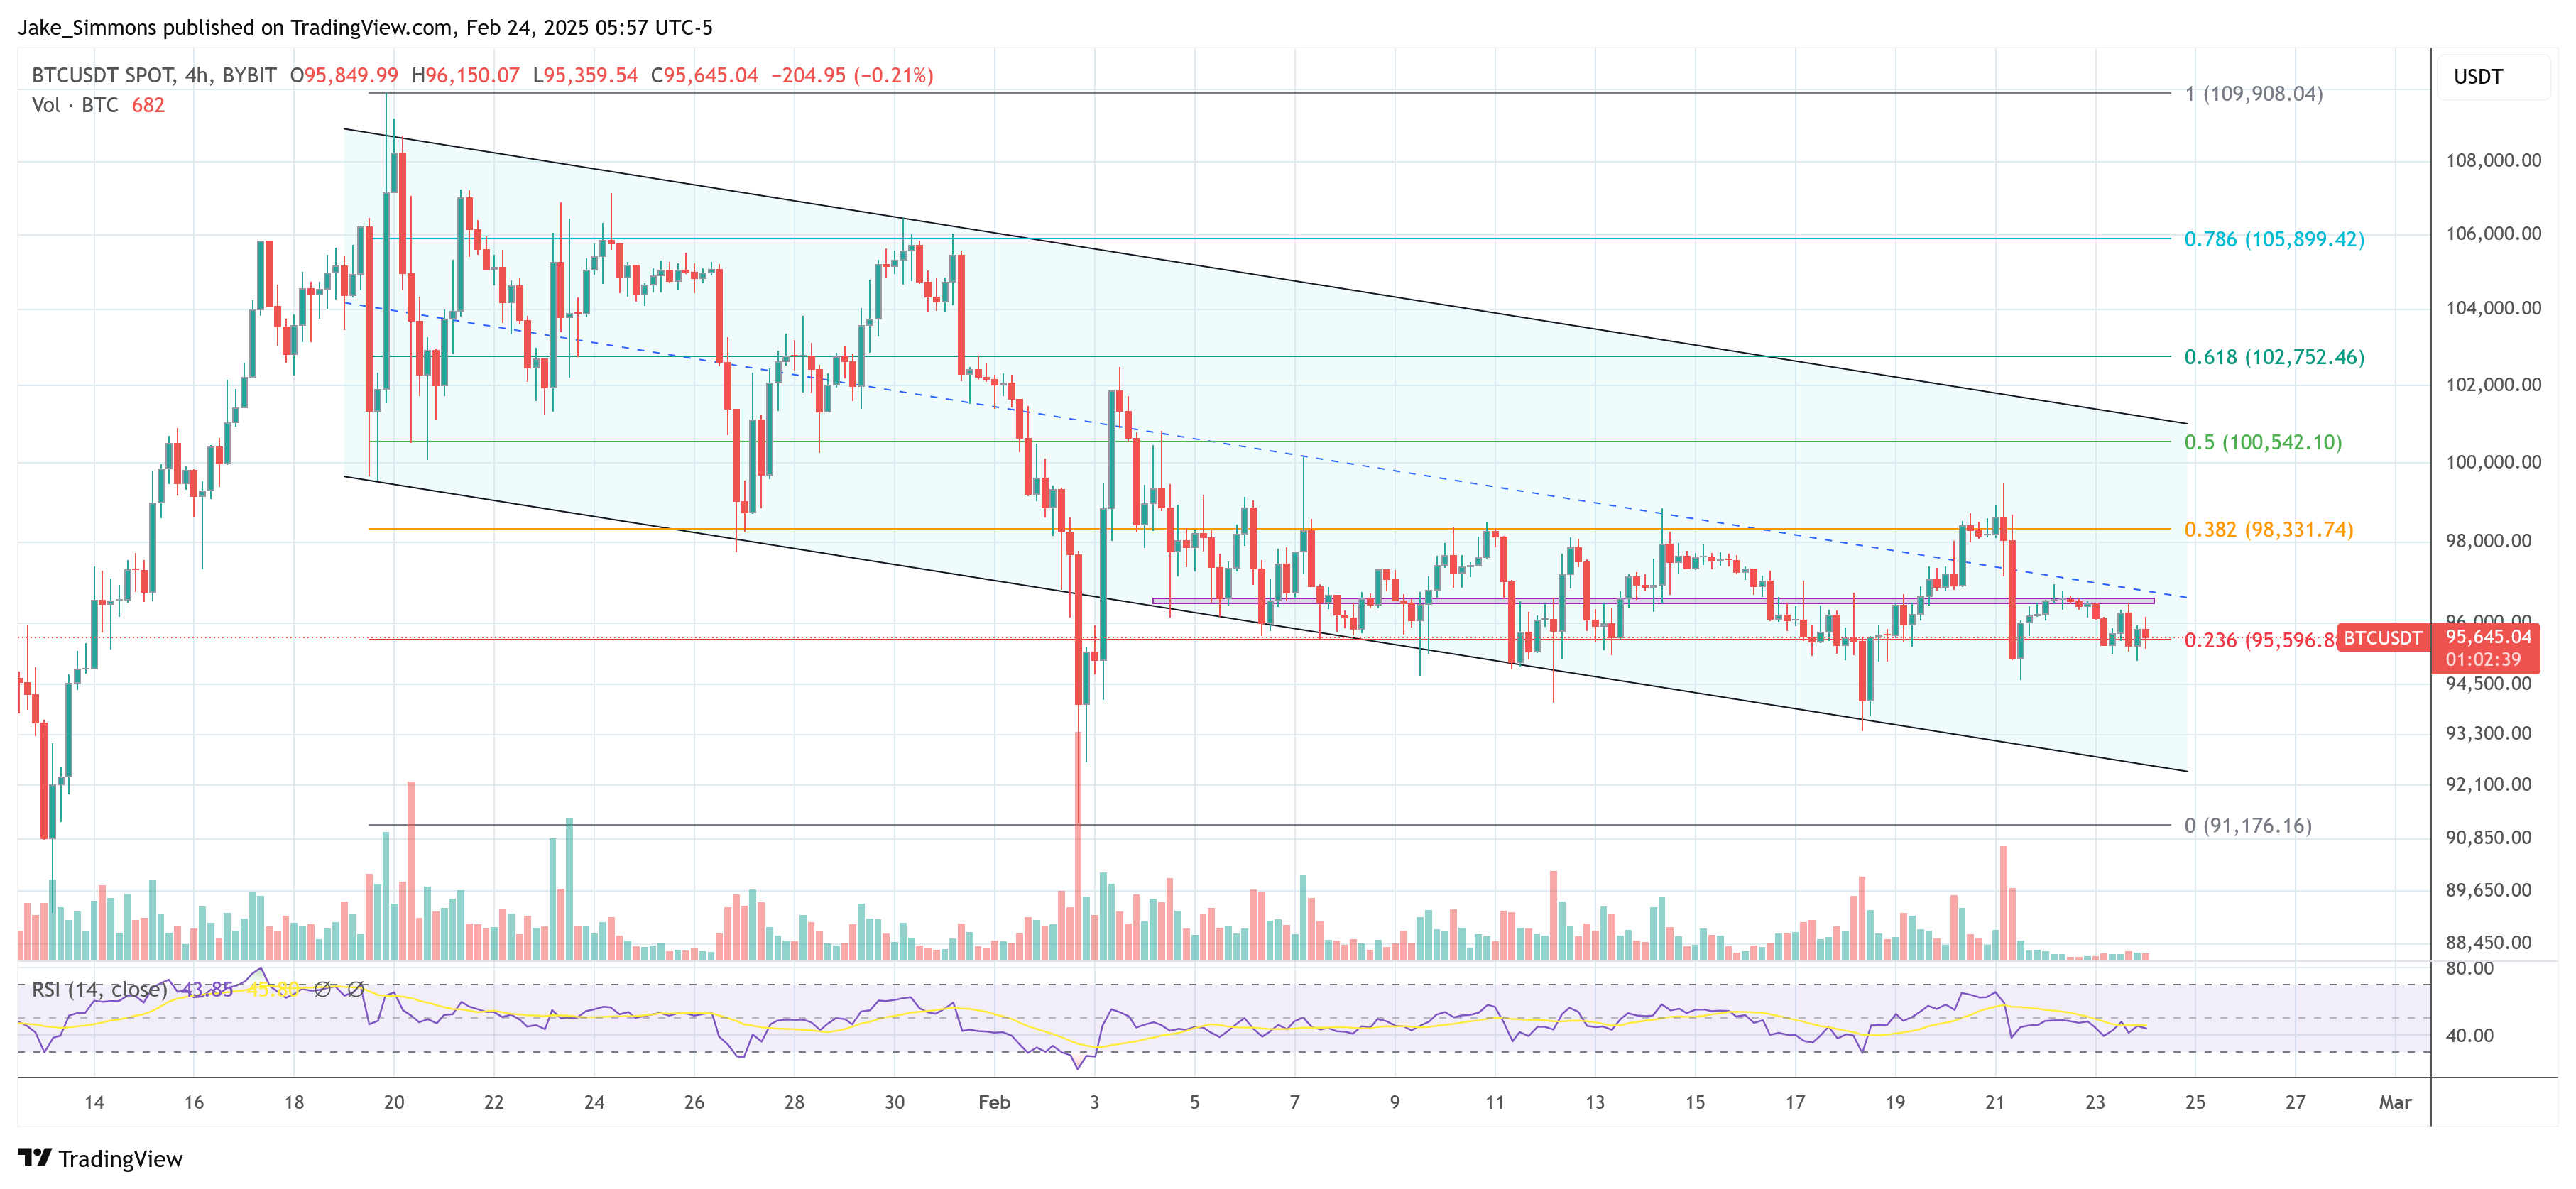
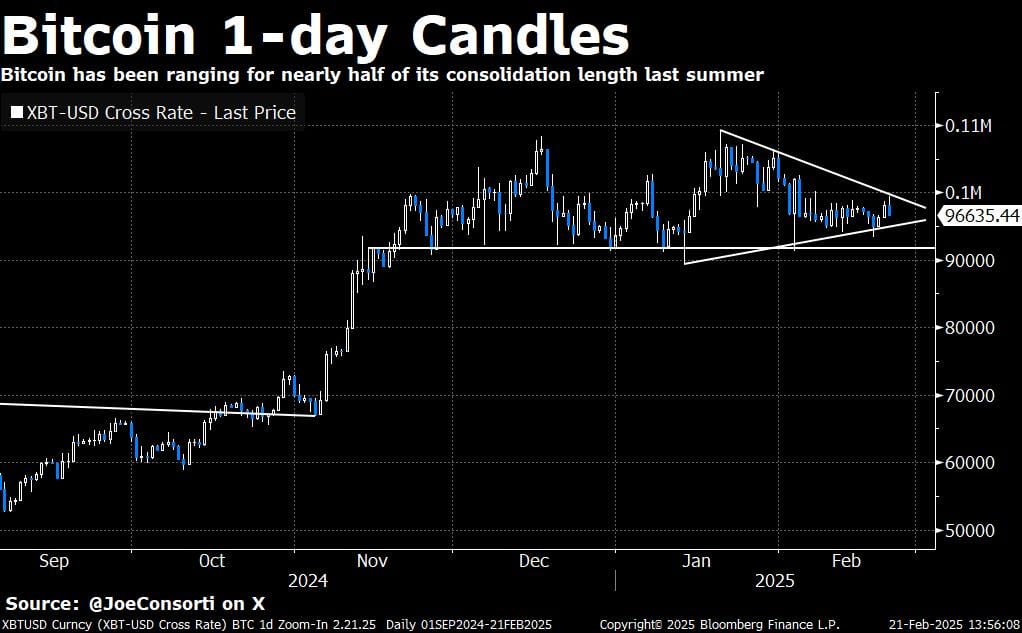
According to Consorti, Bitcoin has now entered its 100+ day consolidation range around $95,000—a stretch he compares to previous multi-month consolidation phases that eventually resolved in major price expansions.
The research provides a retrospective look at how LTHs behaved in previous price climbs: “LTHs accumulated BTC from $15k to $25k, before selling to new market entrants (short-term holders) who bid the price up to the next ‘step’. They did the same from $25k to $40k, from $40k to $65k, and from $65k to the ~$95,000 range we find ourselves in now.”
Consorti notes that LTHs have lately turned back into net accumulators. Although the shift is slight, he contends this behavior usually marks the tail end of consolidation before another breakout.
The researcher also points to a recent $1.4 billion Ethereum hack on Bybit—allegedly the largest in crypto’s history—as a factor momentarily knocking bitcoin off an attempt to break out of its falling wedge pattern. Despite the market disruption, bitcoin only slipped 1.75% on the day, which Consorti says is a testament to the leading BTC’s “outright strength” and diminishing correlation to broader crypto assets.
Overall, Consorti expects the falling wedge to “resolve itself by the first week of March,” barring additional black swan events. He also observes that Bitcoin’s current consolidation zone may stretch beyond 101 days, cautioning that “maximum pain in the market” could see it extend to 236 days, mirroring last summer’s protracted consolidation period.
Consorti also references the possible impact of President Trump’s working group on Bitcoin, which is set to decide on the viability of a Strategic Bitcoin Reserve by the end of June. Should a final decision come sooner, he suggests it may provide a major spark for the market—either bullish or bearish, depending on the outcome.
Spot ETF inflows, once seen as a main propeller of Bitcoin’s price, have diminished since early January. Although they still show 7–8 figure daily inflows, these are down significantly from the 9–10 figure levels that occurred throughout last spring and fall, hinting that other market forces, such as institutional and on-chain dynamics, might be more influential in this cycle’s price movement.
Another topic is Bitcoin’s dislocation from global M2 money supply, which had tracked the price with uncanny accuracy for nearly 18 months. That correlation broke when global M2 suggested a deeper downturn for bitcoin, yet BTC continued to hover around $95,000. Now that M2 is edging upward again on a weaker US dollar, the research suggests the possibility of Bitcoin aligning for its next leg higher.
Comparing Bitcoin to gold with a 50-day lead likewise implies that gold’s recent trajectory may “point to an upside resolution”, albeit less precisely than M2 correlations. If this holds, a push towards $120,000 appears plausible.
Related Reading
Consorti concludes by shifting attention to the evolving landscape of US Treasury (UST) demand. Major foreign holders such as China and Japan have progressively reduced or flatlined their positions—China’s holdings have reached a 2009 low of $759 billion, while Russia has fully exited, and Japan remains at $1.06 trillion for 13 years. “It’s not just China. Russia has fully exited USTs. Japan, the largest foreign holder, has been sitting flat at $1.06 trillion for 13 years.”
Meanwhile, the US Federal Reserve’s share of outstanding marketable USTs has surged from 22% in 2008 to 47.3% in 2025, stepping in as foreign demand wanes. But a new player is joining the market in the form of stablecoins, which collectively hold about $200 billion in Treasuries to back their dollar-pegged tokens. According to Consorti, this stablecoin demand: “Could lower long-term interest rates. The proliferation of stablecoins and their use of Treasuries as a reserve asset means they’re functioning like an entirely new foreign central bank.”
He argues that stablecoins effectively ensure fresh demand for Treasuries, helping the US government offset declining foreign involvement and sustain its borrowing needs. White House AI & Crypto Czar David Sacks has publicly echoed this perspective, saying stablecoins help maintain liquidity for US debt.
At press time, BTC traded $95,645.

Featured image created with DALL.E, chart from TradingView.com


