
Reason to trust
Strict editorial policy that focuses on accuracy, relevance, and impartiality
Created by industry experts and meticulously reviewed
The highest standards in reporting and publishing
Strict editorial policy that focuses on accuracy, relevance, and impartiality
Morbi pretium leo et nisl aliquam mollis. Quisque arcu lorem, ultricies quis pellentesque nec, ullamcorper eu odio.
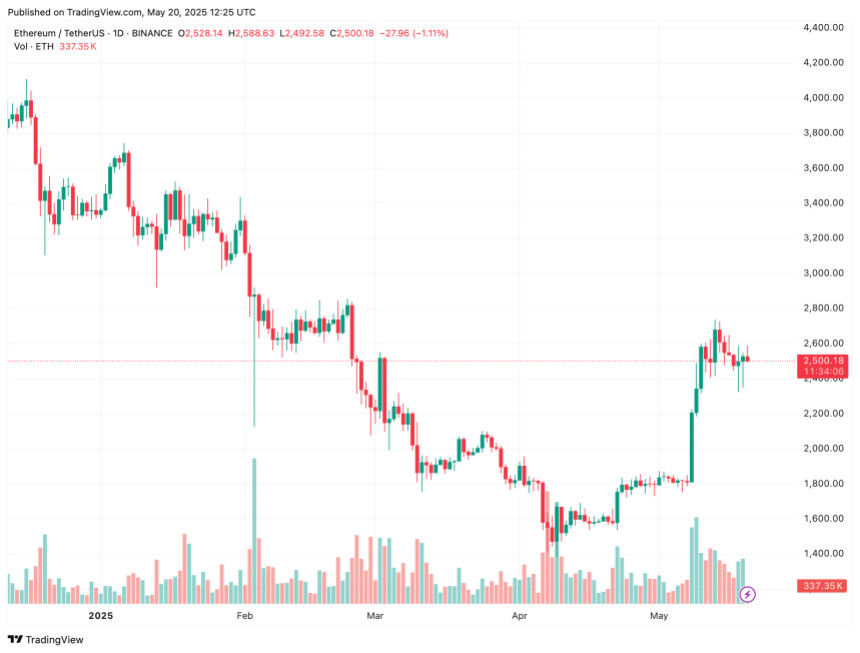
As Ethereum (ETH) continues to hover around the $2,500 mark, signs of market exhaustion are beginning to emerge. Analysts suggest the second-largest cryptocurrency by market cap could face a short-term pullback before attempting to break through higher resistance levels.
Ethereum Showing Signs Of Overheating
According to a CryptoQuant Quicktake post by contributor ShayanMarkets, ETH is beginning to show signs of an overheated rally. The analyst shared the following chart illustrating ETH’s total trading volume across various crypto exchanges.
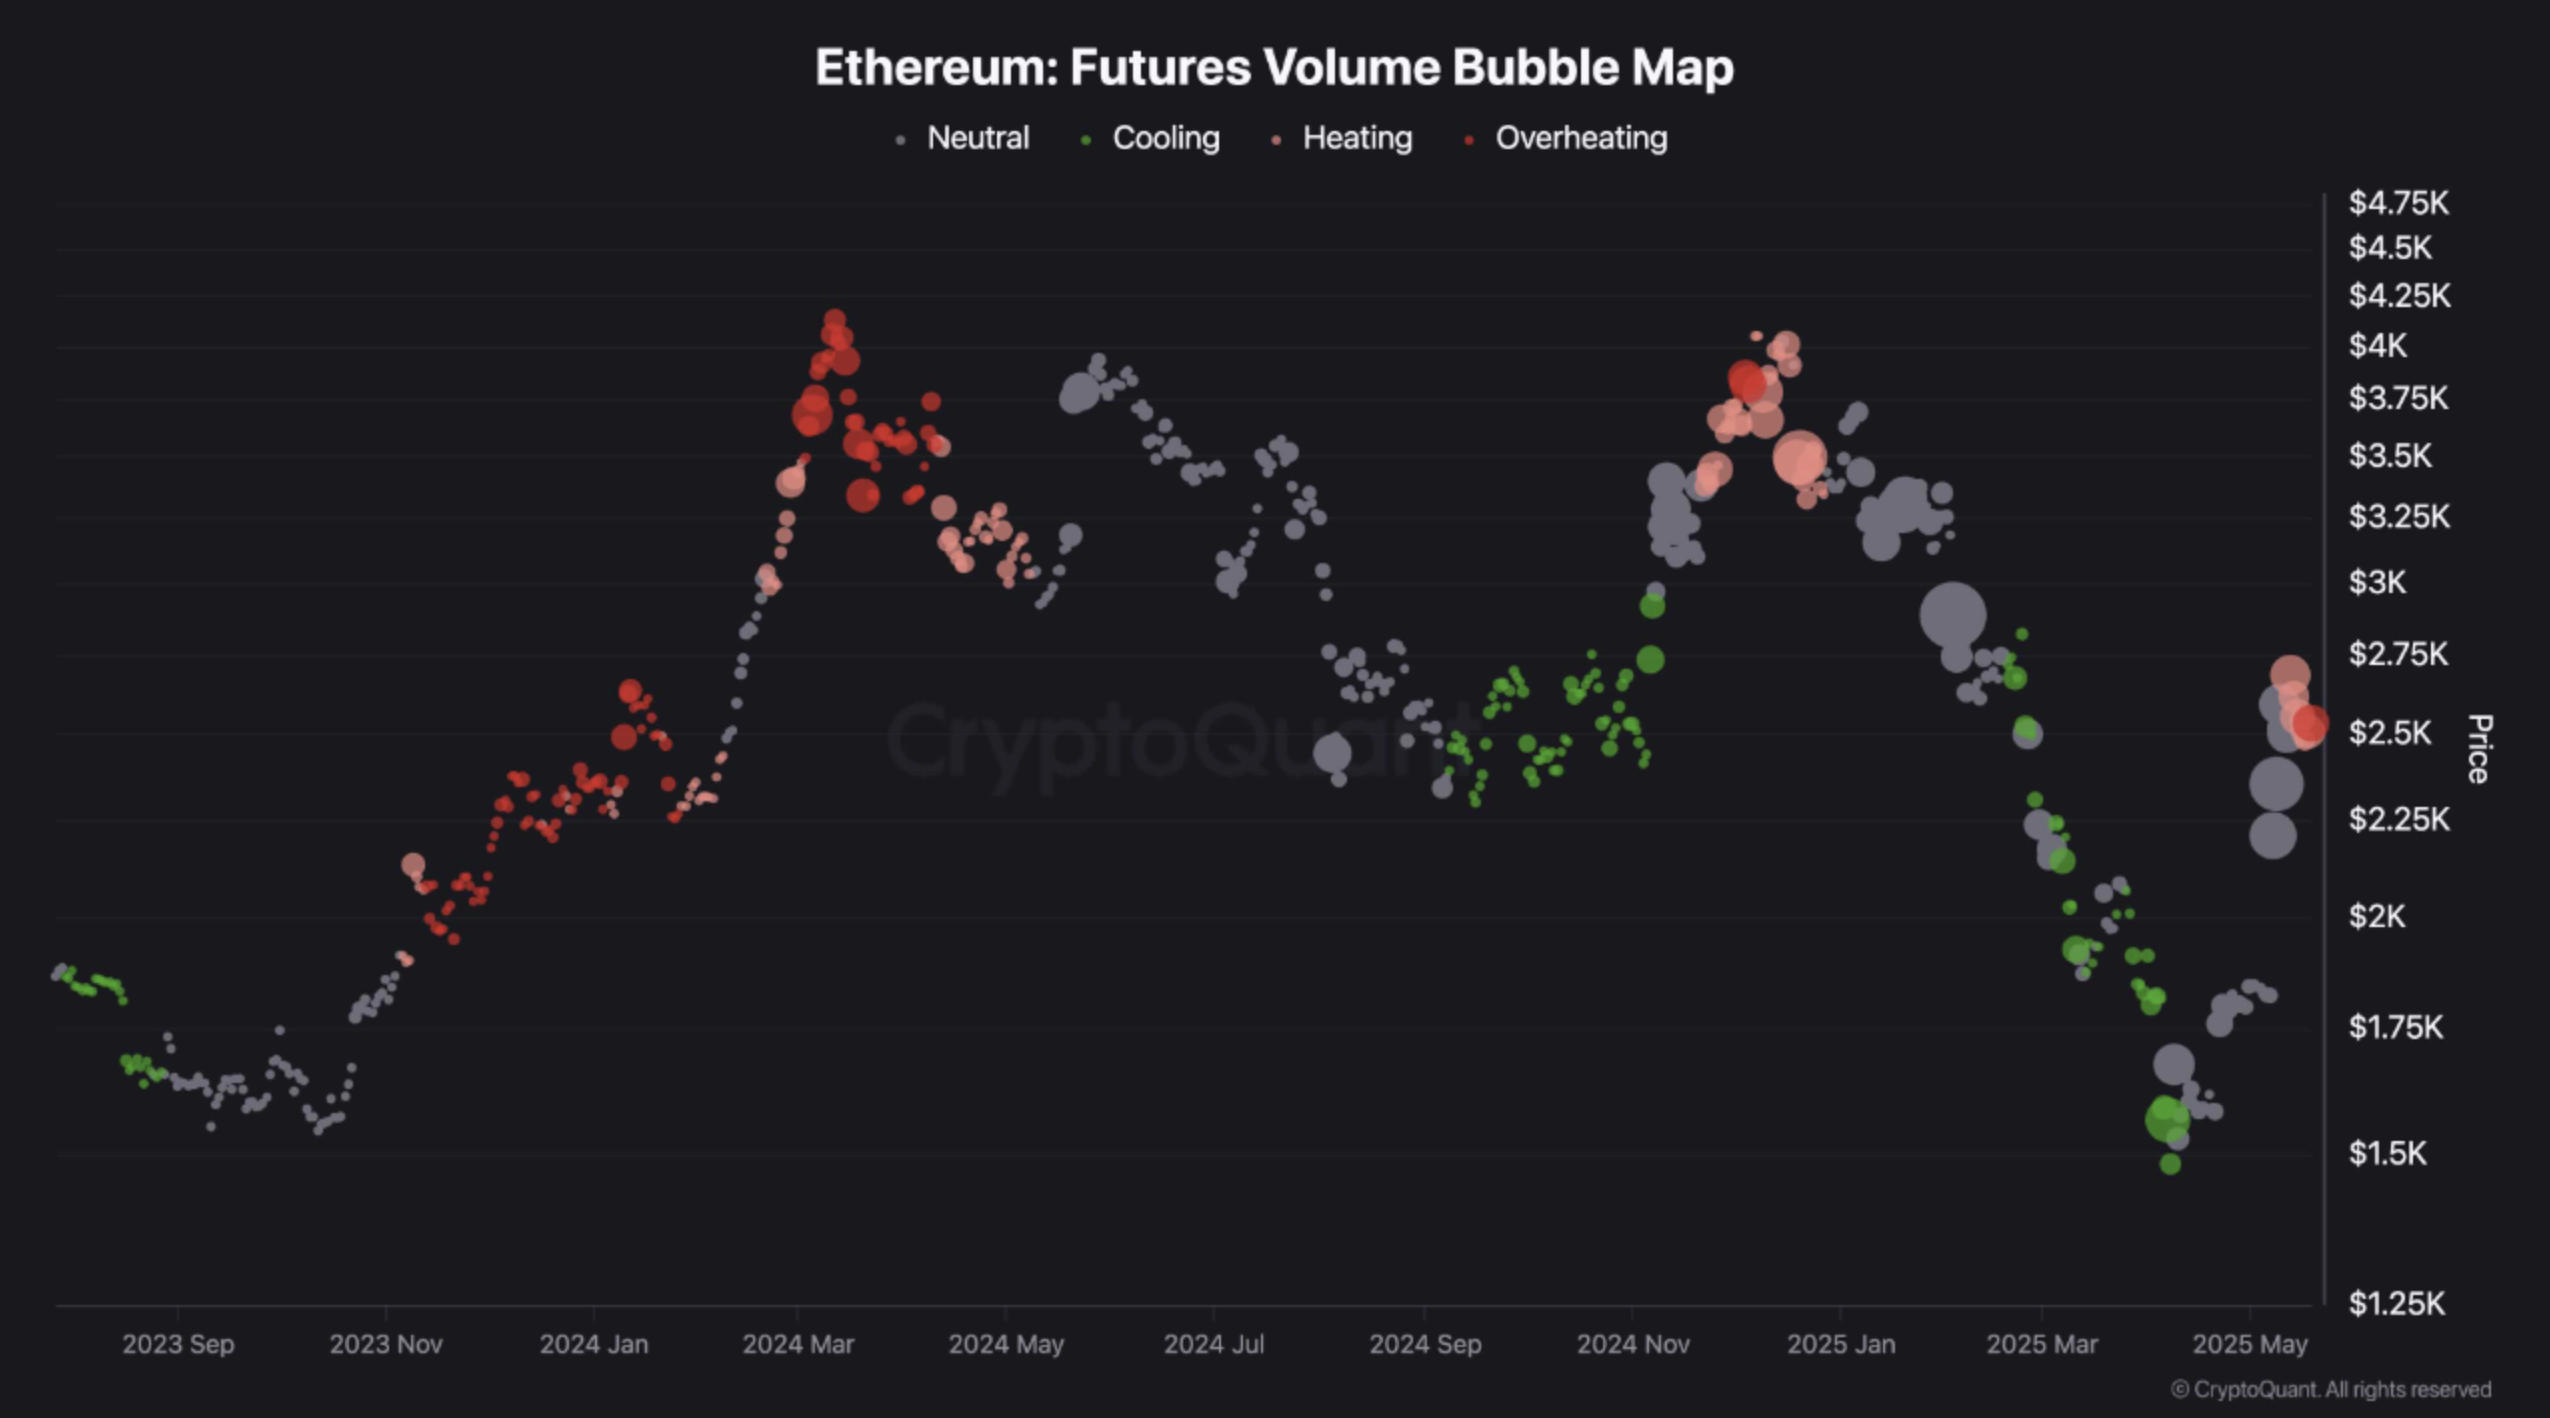
In this chart, each bubble’s size reflects the magnitude of trading volume, while the color indicates the rate of volume change, categorized into four groups – Cooling, Neutral, Overheating, and Highly Overheating.
Related Reading
Ethereum’s ongoing price rally, which began in mid-April 2025, has seen a notable surge in trading activity. Within just a month, the asset’s market condition shifted from Cooling (green bubbles) to Overheating (red bubbles).
The current overheated condition may lead to a short-term correction as the market cools and enters another accumulation phase. However, the depth and duration of any potential pullback remain uncertain.
The CryptoQuant contributor attributes this spike in volume to profit-taking and significant resting supply at the psychologically important $2,500 resistance level. Data from CoinGecko shows ETH has jumped an impressive 59.7% over the past 30 days, outperforming Bitcoin (BTC) during the same period. ShayanMarkets concludes:
Consequently, Ethereum is expected to continue its consolidation phase until fresh demand emerges to drive a breakout above this resistance range in the mid-term.
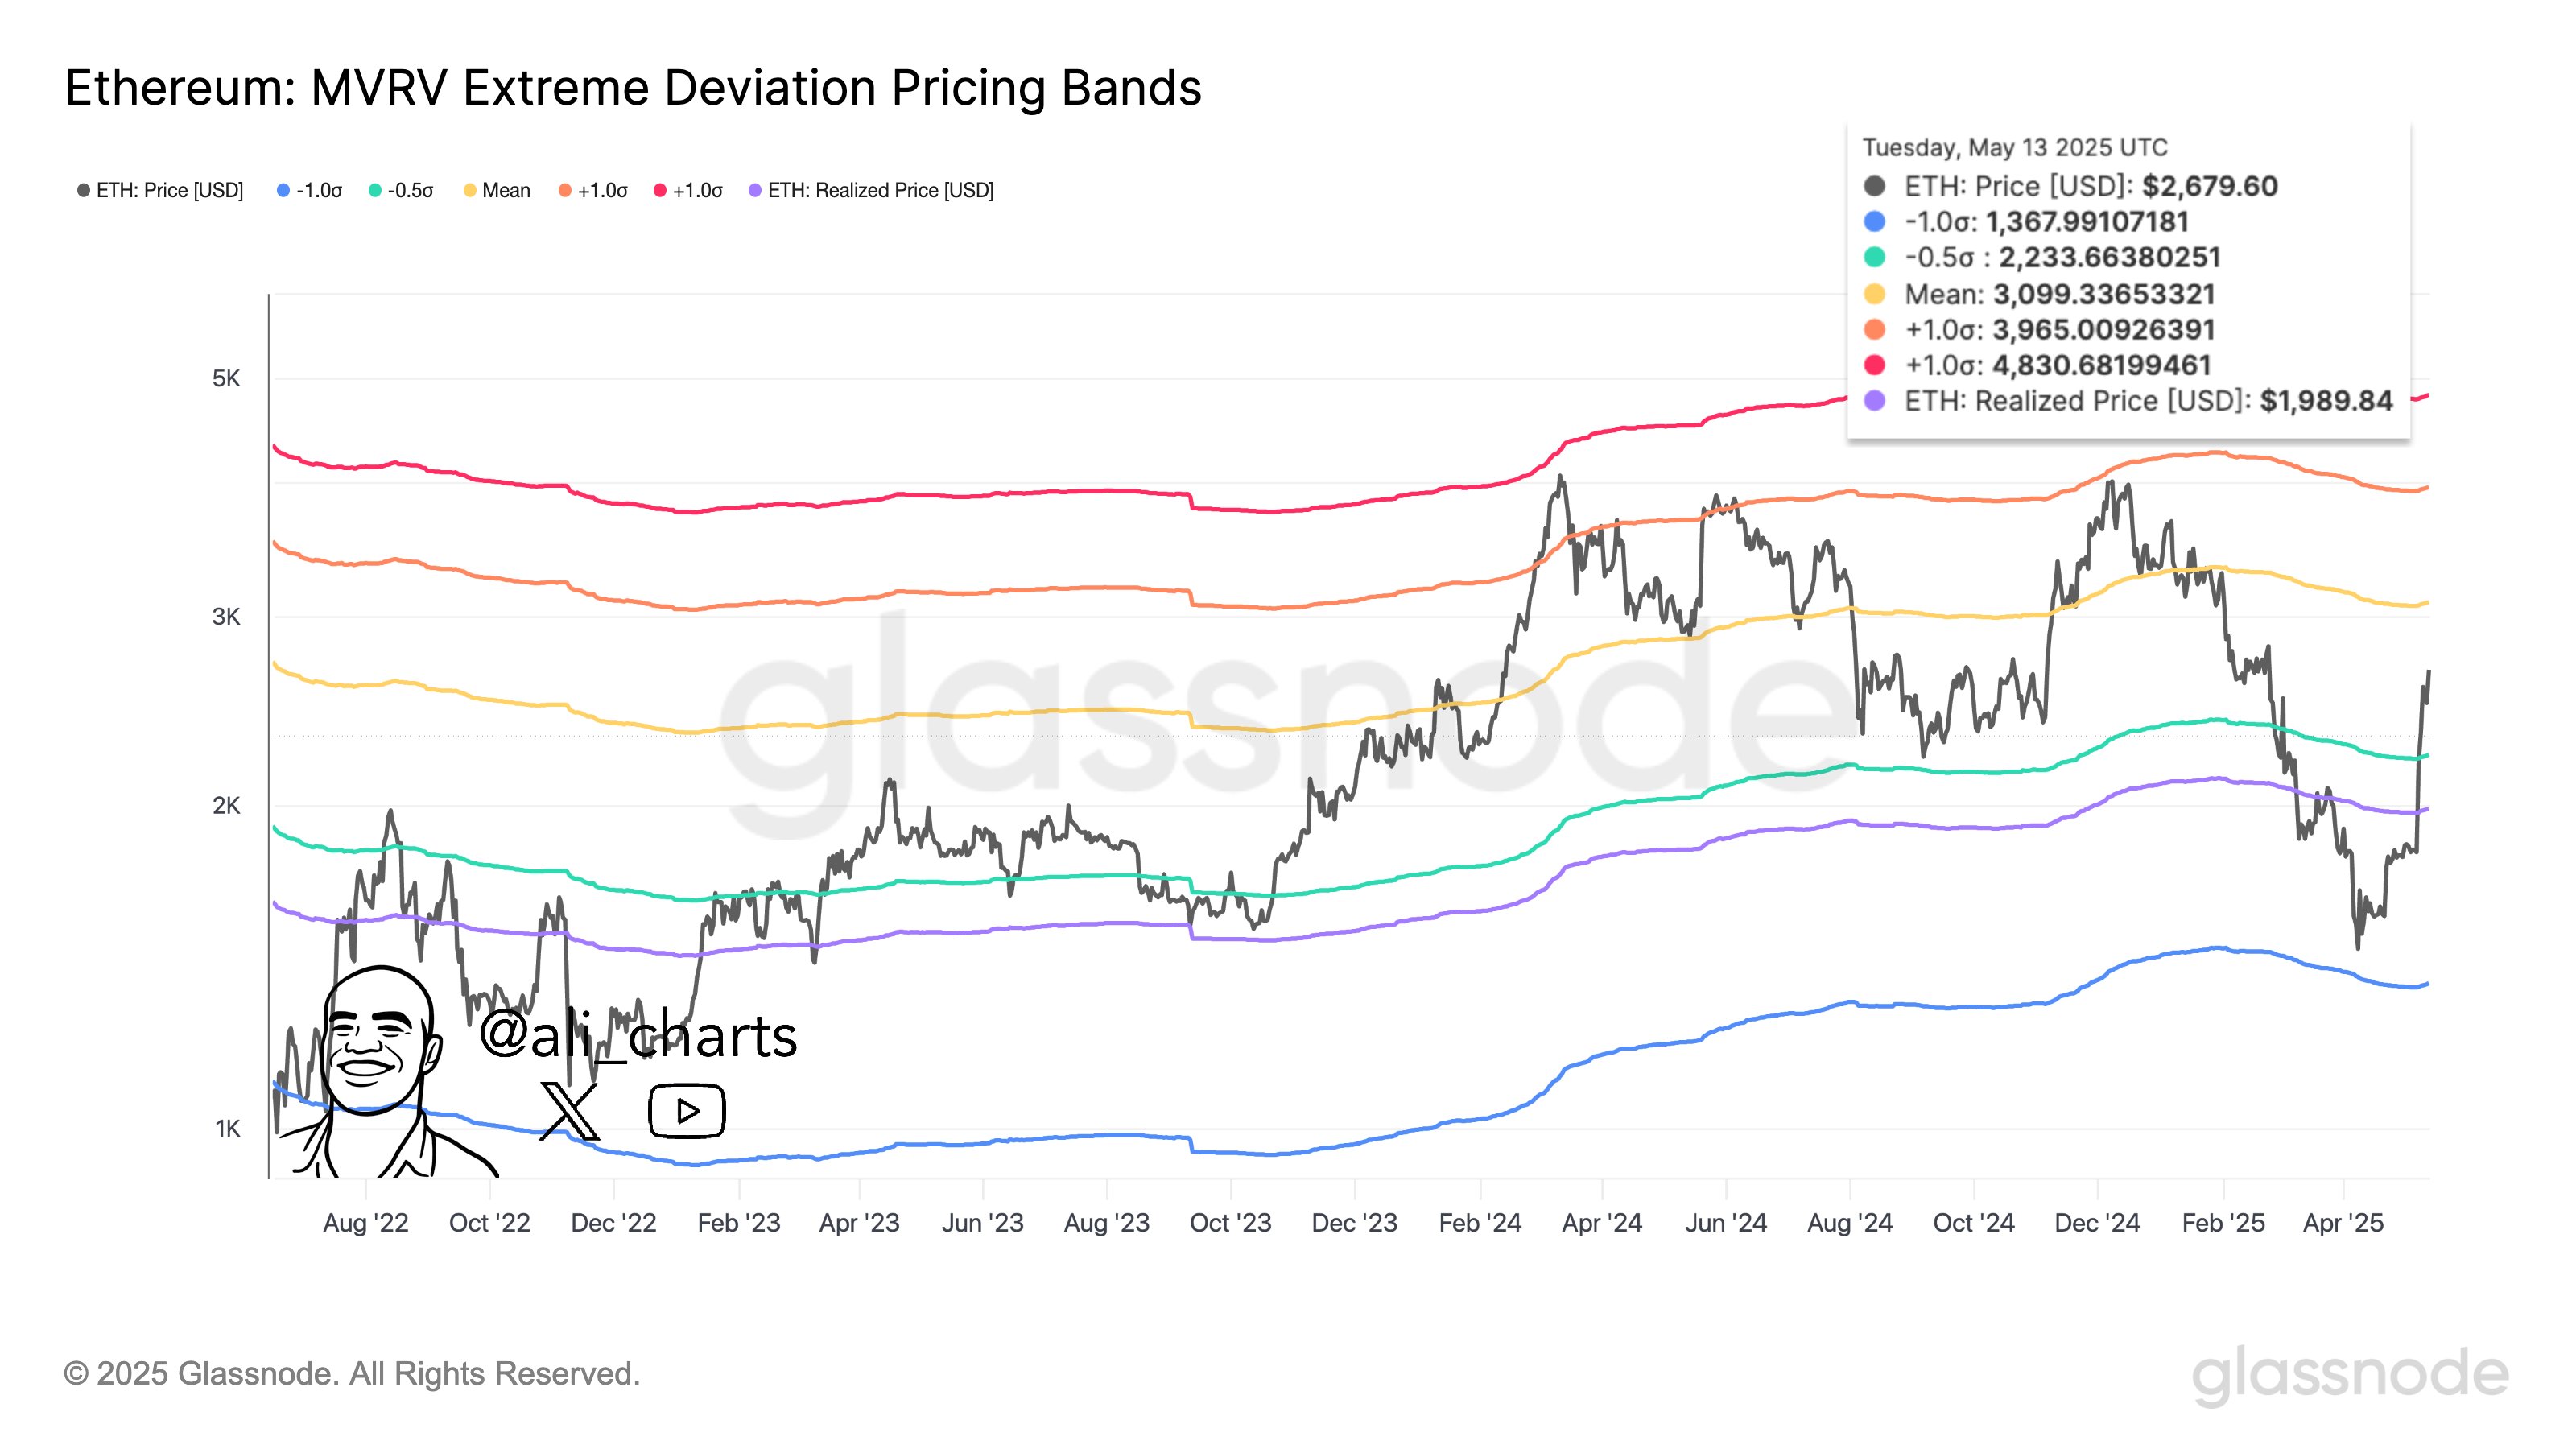
In a separate post on X, veteran crypto analyst Ali Martinez pointed to Ethereum’s Market Value to Realized Value (MVRV) extreme deviation pricing bands. He emphasized that ETH must hold above $2,200 to maintain bullish momentum. Should this level hold, Martinez believes ETH could target $3,000, or potentially even $4,000, if buying pressure strengthens.
Where Is ETH Headed? Analysts Weigh In
Ethereum’s impressive performance of late has attracted attention from several crypto analysts, who are now speculating the digital asset’s future price trajectory. According to crypto analyst Ted Pillows, ETH’s 12-hour chart recently confirmed a Golden Cross, a bullish signal that typically precedes major price rallies.
Related Reading
In another analysis, Pillows forecasted that ETH could be eyeing a move to $4,000, noting that the asset has traded within a massive symmetrical triangle since Q3 2020. The $4,000 level lies just below the triangle’s upper boundary.
In contrast, crypto analyst Gianni Pichichero warned of a potential retracement to $2,350, citing the emergence of lower lows on Ethereum’s daily chart as a bearish signal. At press time, ETH trades at $2,500, up 3.6% in the past 24 hours.
Featured image from Unsplash, charts from CryptoQuant, X, and TradingView.com

