Reason to trust
Strict editorial policy that focuses on accuracy, relevance, and impartiality
Created by industry experts and meticulously reviewed
The highest standards in reporting and publishing
Strict editorial policy that focuses on accuracy, relevance, and impartiality
Morbi pretium leo et nisl aliquam mollis. Quisque arcu lorem, ultricies quis pellentesque nec, ullamcorper eu odio.
The final week of April delivered a jolt of optimism to a crypto market that has spent most of the year wrestling with macro cross-currents. Bitcoin’s resilience above the psychological $90,000–$95,000 level, an unexpected surge in stablecoin issuance and a swarm of textbook bullish patterns across large-caps and meme names have converged to create what veteran chartist Josh Olszewicz calls “one of the cleanest multi-asset breakout tapes we’ve seen since late 2023.”
Crypto Bull Run Back?
Olszewicz’s argument begins and ends with liquidity. Two consecutive one-billion-dollar Tether mints on 29 April pushed combined USDT + USDC supply to a fresh all-time high, an event he frames as an unequivocal tailwind for speculative assets. “Tether’s been printing, printing, and minting, baby,” he said, emphasising that the dual $1 billion tranches arrived alongside a clear premium in the USDT/USD pair on Kraken—evidence, in his view, of real demand rather than opportunistic treasury rebalancing. “Typically that means people are deploying it in alts. That’s why stable-coin mints—specifically Tether—[are] generally bullish for alts because people are using it to speculate.”
The liquidity pulse arrives just as several macro obstacles appear to be receding. Bitcoin survived a negative-print US GDP release, sticky PCE inflation data and what Olszewicz called “some jobs numbers that came out this week,” without surrendering its three-month up-trend. Meanwhile gold has rolled over and the Dollar Index remains pinned near cycle lows, recreating the “everything-rally” backdrop that powered crypto’s late-2023 melt-up. Funding markets, however, are delivering a curious split: “We still have negative funding on the BTC side on crypto exchanges. We have positive funding in legacy land with futures. So that’s very bizarre right now, but so far so good.”
Against that backdrop, Olszewicz drills into the Ichimoku-cloud mechanics that underpin his altcoin watch-list. The premise is as old as the indicator itself: a daily candle close inside the cloud accompanied by a bullish Tenkan-Kijun (TK) cross triggers a mean-reversion target to the opposing edge of the cloud. “All these trades are always the same. I never treat them differently,” he said. “You get a better entry… it’s just a game of probabilities.” The strategy sets clear invalidations—either the Kijun line or a lower-low—and provides what he characterises as Dow-theory mean-reversion framed through an Ichimoku lens.
That formula is now flashing across a surprising breadth of assets.
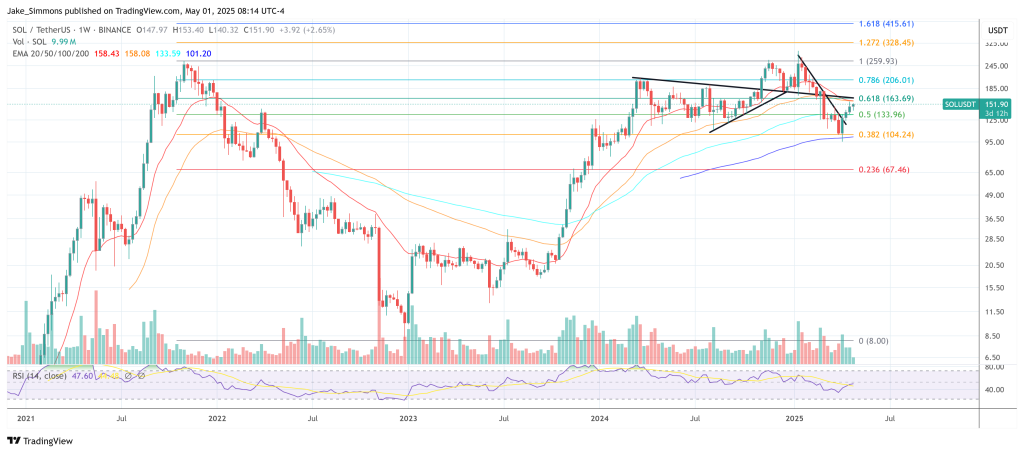
Solana And Curve
Solana sits at the top of his list. The layer-one token has posted six consecutive red daily candles, sculpting the “right shoulder” of an inverted head-and-shoulders whose neckline rises toward $200. “What I’ve got to laser focus on is this potential edge-to-edge move,” he explained, noting that ideal entries would materialise between $140 and $120 but are not essential. “Within the next week or two, you should get a great signal on an entry here on SOL just from the cloud.”
Related Reading
Curve, by contrast, is already in motion—up double-digits on a day when most altcoins bled. “Why is it up 10 percent today and everything else is down? I don’t have a good answer for that,” he admitted. Yet the technical structure leaves little to interpret: a multi-month flat-bottom accumulation, a candle close inside the cloud near its lower boundary and a bullish TK cross. “You’re on your journey to somewhere up here—the other edge of the cloud,” he said, implying a measured-move objective near $1.20 that would represent a near-doubling from current levels.
Ethereum And Litecoin
Where Solana and Curve show imminent triggers, Ethereum remains the quintessential laggard, still chiselling out what Olszewicz labels a bottoming process. “It’s going to take ETH kicking and screaming to get started here […] but this is a bottom in process. Certainly may take you into June.” The calculus is familiar: traders intent on rotation may find better risk-adjusted returns elsewhere, returning to ETH only once its own daily cloud admits a candle close.
Litecoin exhibits a similar dynamic, with an inverted head-and-shoulders outline that “feels a little early,” perhaps ripening by early June.
FET, LINK, ALGO
Fetch.ai breached the cloud on April 23 and already sports a bullish TK cross, yet Olszewicz acknowledges it arrives “after two or three weeks of up-move,” reducing risk-reward.
Related Reading
Chainlink shows a textbook right-shoulder still under construction—“alerts at fifteen,” he suggests—while Algorand edges toward a 32-cent cloud target, one daily close away from confirmation.
In each instance, the analyst reiterates that until the formal triggers print, the probability of follow-through remains statistically lower.
DOGE, PEPE And WIF
The most combustible corner of the market—the meme cohort—is, in his telling, already foreshadowing a retail return. Dogecoin intrigues him most. “Along with ENA, one of the best bang for your bucks is Doge,” he said, though he concedes the pattern needs another week to sculpt a complete right-shoulder. He is explicit about his trigger: “Give it another week or two and this is definitely one of the better-looking setups,” with attention fixed on the $0.175 area.
PEPE presents fewer moving parts: it is inside the cloud with a bullish TK cross and a clear neckline at the Kijun. “If ETH even sneezes higher, I expect this to just be up twenty-five percent one day,” he said, while cautioning that a transitional “negative twenty percent day” could precede the pop.
WIF, for its part, is “slamming against the cloud,” on the cusp of its own TK cross. Having retraced from $4.80 to current levels, it offers what he calls “a great-looking setup,” albeit one where “the greed in me always wants an entry down here”—a reference to a hypothetical bid parked at the cloud’s lower edge.
BTC Dominance
Bitcoin dominance, still pressing cycle highs, complicates the rotation narrative. “Does it really matter that you’re not all-in BTC if this is an extreme in dominance?” he asked rhetorically. His answer is temporal. Dominance mattered enormously at the October 2023 bottom, and he suspects it will matter again once it rolls over.
“Come May, June, I think we will start to see the outperformance of the altcoins,” he predicts, but he tempers that with a blunt reminder: “It hasn’t made sense to sit in these BTC pairs.” The exception is Solana’s BTC chart, which mirrors the USD thesis with a half-formed inverted head-and-shoulders and a cloud target significantly higher.
At press time, SOL traded at $151.90.
Featured image created with DALL.E, chart from TradingView.com

