
Bitcoin is trading just above the pivotal $103,600 level, a critical support zone that has acted as a key threshold for bulls throughout this cycle. If it fails to hold, analysts warn that BTC could swiftly drop below $100,000, triggering a broader correction across the crypto market. This comes as global markets react to escalating geopolitical risk—Israel launched a surprise attack on Iran, prompting immediate retaliation and fueling volatility across commodities, equities, and digital assets.
Despite the turmoil, Bitcoin continues to show relative strength, holding above the $100K psychological level even as investors flee risk assets. Top analyst Darkfost highlights a unique dynamic in this cycle: the unusual decoupling between Bitcoin and bond yields. Historically, rising US Treasury yields have coincided with crypto drawdowns. However, in the current environment, Bitcoin has continued to trend upward, even as yields sit near some of the highest levels in its history.
According to crypto analyst Darkfost, Bitcoin’s bullish momentum appears to be increasingly influenced by weakness in the US Dollar Index (DXY). Each time the dollar retreats, BTC has shown strong acceleration, suggesting global liquidity flows may be favoring Bitcoin as an alternative macro hedge. The next few days will be crucial.
Bitcoin Shows Resilience Amid Geopolitical Risk
After failing to break above the $112,000 resistance, Bitcoin dropped over 6%, sparking concern that bears may push the price below critical support. However, despite the volatility, BTC remains resilient—holding above the $103,600 mark—even as the ongoing conflict between Israel and Iran rattles global markets.
Darkfost emphasizes the growing importance of macroeconomic indicators like the DXY and US Treasury yields. These metrics increasingly dictate institutional sentiment and global liquidity flows. Traditionally, when both the DXY and yields climb, capital exits risk assets, leading to sharp corrections in Bitcoin and broader crypto markets. Historically, this macro environment has marked the onset of bear markets for BTC.
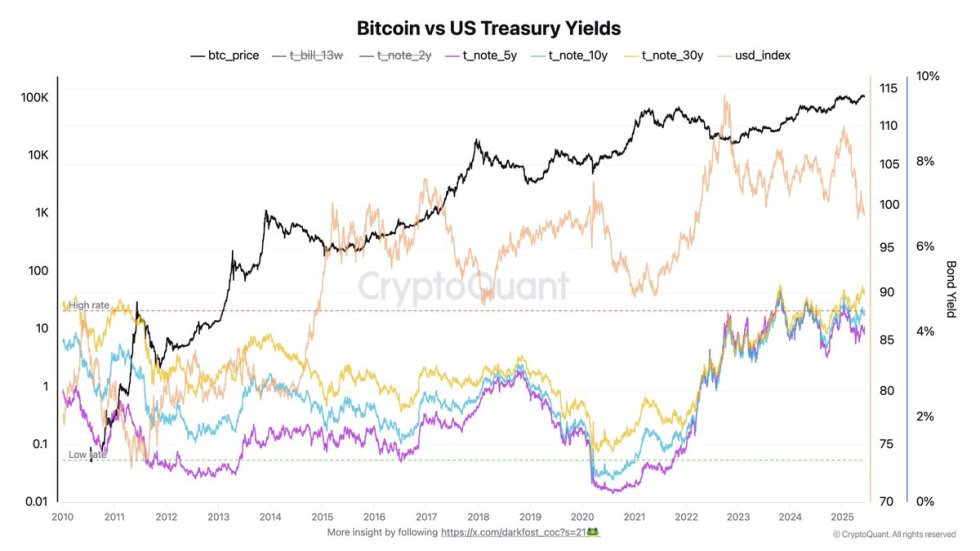
Conversely, when the DXY and yields begin to stall or fall, investor confidence in risk assets tends to return. Such periods often coincide with monetary easing or speculation over future interest rate cuts by the Federal Reserve—conditions that ignite bullish momentum in the crypto space.
What makes this cycle unique, according to Darkfost, is Bitcoin’s divergence from rising yields. Despite yields reaching multi-year highs, BTC has continued trending upward, particularly when the DXY softens. This decoupling signals a possible structural shift in how Bitcoin behaves relative to traditional financial metrics.
One explanation for this anomaly is the evolving perception of Bitcoin as a macro hedge and store of value. With inflation concerns and sovereign debt risks on the rise, institutional capital may now be treating BTC not merely as a speculative asset, but as a hedge against systemic risk. If this narrative continues gaining traction, Bitcoin could carve out a new role within the global financial landscape—one that redefines its relationship with macro forces.
Bulls Defend Critical Support Amid Renewed Volatility
Bitcoin is currently trading around $105,300 after a volatile session triggered by geopolitical tensions and macro uncertainty. The chart shows that BTC briefly dipped below the $103,600 support level—a key horizontal demand zone—but managed to reclaim it swiftly, suggesting strong interest from buyers at lower levels.
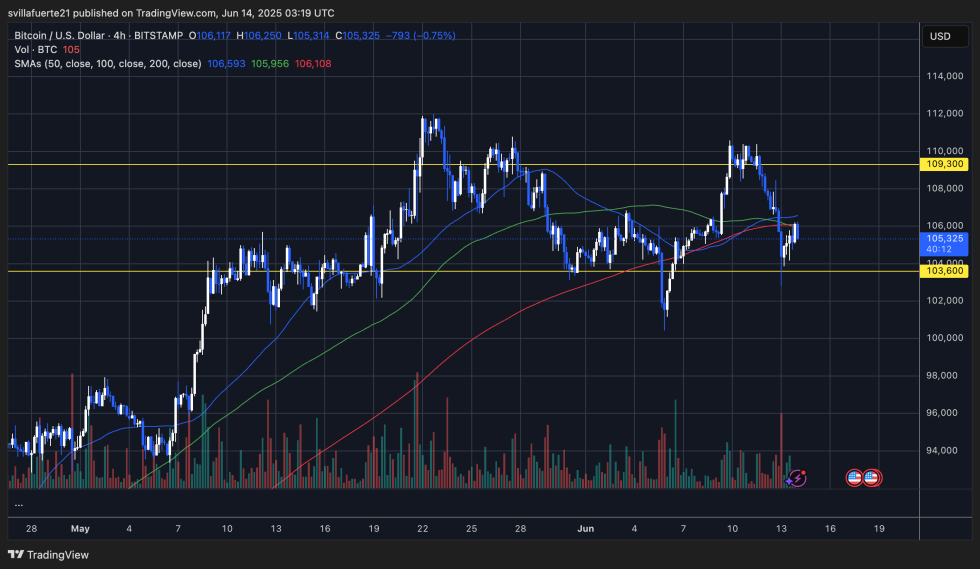
The 50, 100, and 200-period SMAs are clustered between $105,950 and $106,600, and currently act as dynamic resistance. For Bitcoin to regain bullish momentum, it must break above this confluence of moving averages and reclaim the $106,600–$107,000 zone. Failing to do so could open the door to another retest of the $103,600 level, which has been tested multiple times since early May.
Volume spiked during the most recent drop, indicating capitulation or forced selling, often followed by short-term recoveries. However, buyers will want to see sustained strength above $106,000 to consider this a true reversal rather than a relief bounce.
Featured image from Dall-E, chart from TradingView

Editorial Process for bitcoinist is centered on delivering thoroughly researched, accurate, and unbiased content. We uphold strict sourcing standards, and each page undergoes diligent review by our team of top technology experts and seasoned editors. This process ensures the integrity, relevance, and value of our content for our readers.

