
Bitcoin (BTC) is nearing a bullish Golden Cross formation on the weekly chart, as the largest cryptocurrency by market cap trades just shy of its all-time high (ATH) of $108,786. With a new ATH seemingly within reach, several crypto analysts are weighing in on how high the ongoing rally could propel BTC.
Golden Cross Incoming For Bitcoin As It Flirts With ATH
In a recent post on X, crypto analyst Titan of Crypto shared the following weekly chart highlighting that BTC is on the verge of forming another Golden Cross. The last time BTC experienced this technical pattern was in October 2024, which preceded a historic rally that saw the asset hit multiple new ATHs over the following months.
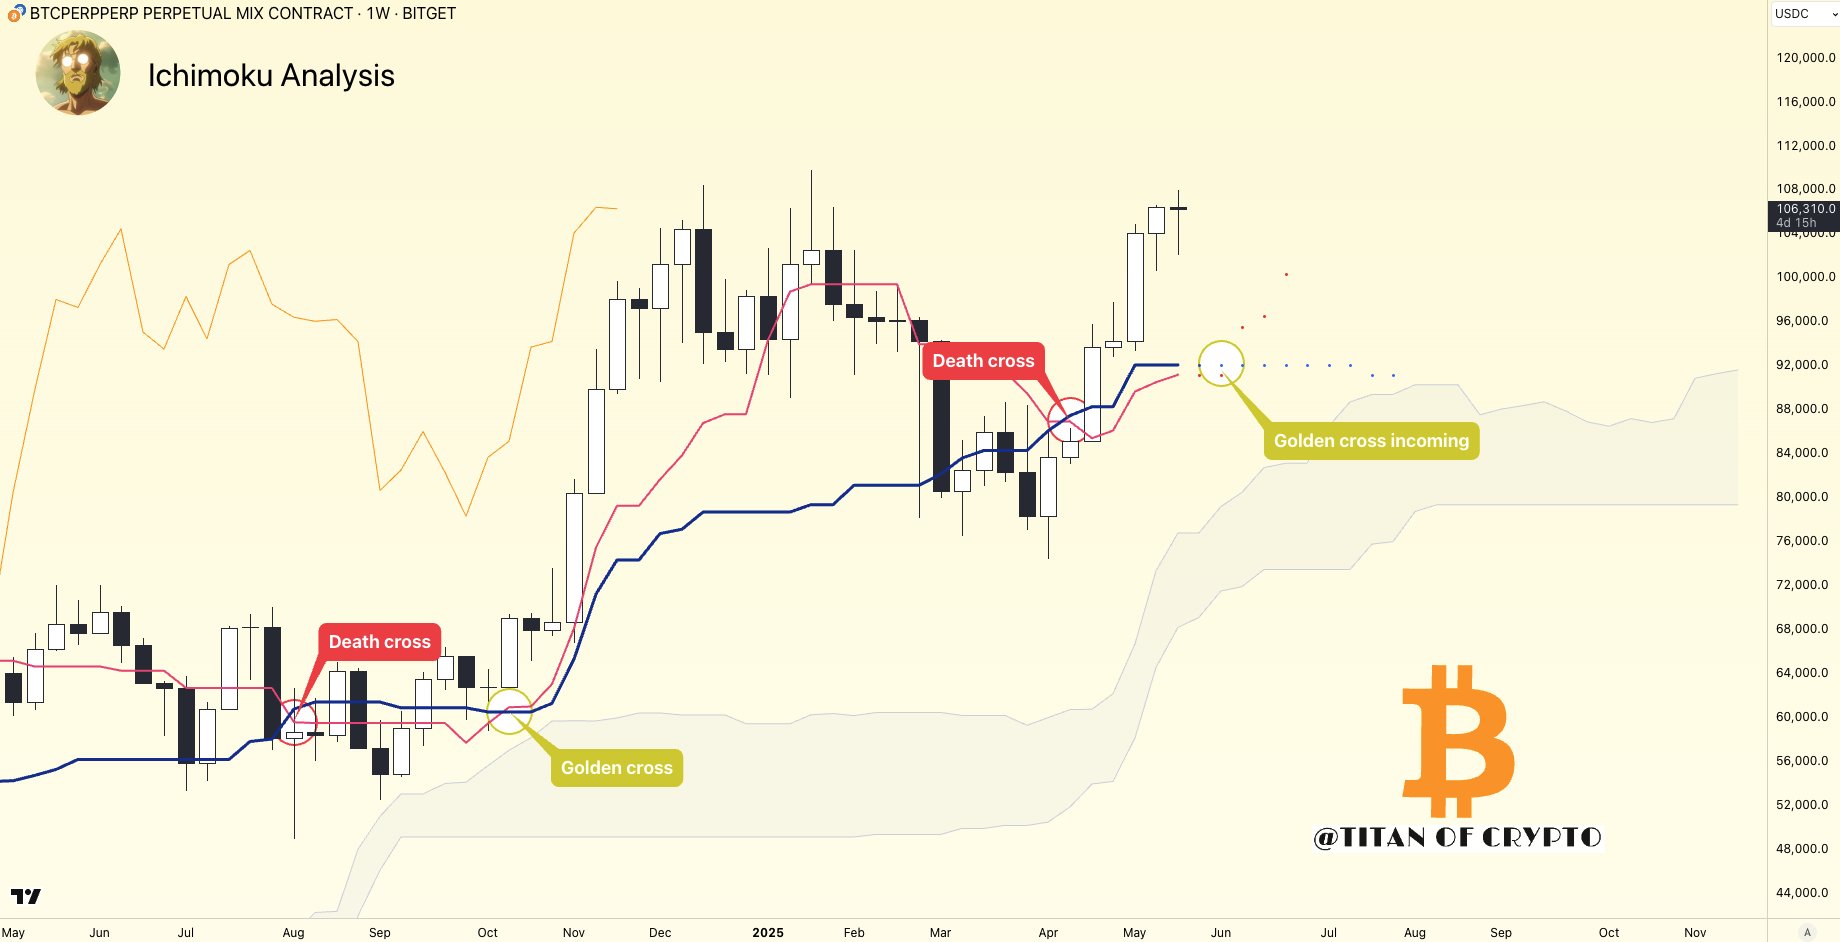
For the uninitiated, a Golden Cross occurs when Bitcoin’s short-term moving average (MA) – typically the 50-day – crosses above its long-term MA – usually the 200-day – signalling a potential shift to a sustained bullish trend. This pattern is widely viewed by traders as a strong indicator of upward momentum.
Bitcoin’s current bullish trajectory has caught the attention of multiple analysts, many of whom are now forecasting further upside. For example, Master of Crypto predicts a rally to $116,000 as BTC breaks out from a bullish pennant formation.
Similarly, crypto analyst CryptoGoos shared the following weekly Bitcoin chart showing BTC breaking out of a price range, while the Moving Average Convergence Divergence (MACD) undergoes a bullish crossover.

As seen in previous cycles, similar MACD crossovers were followed by significant price increases. If the pattern holds, BTC could be on the path to a new ATH.
To explain, an MACD bullish crossover happens when the MACD line – blue line – crosses above the signal line – orange line – indicating a potential shift from bearish to bullish momentum. Traders often see this as a sign that upward price movement may follow.
Is A Short Squeeze Incoming?
In a separate post, prominent analyst Ted Pillows pointed out that BTC’s long/short ratio is currently skewed toward shorts, based on data from major crypto exchanges. Ted suggested that such a setup could trigger a short squeeze, potentially accelerating BTC’s climb to new highs.

Meanwhile, crypto analyst Jelle remarked that BTC is facing just “one last hurdle” before it rallies toward $140,000. Their outlook aligns with another forecast predicting a near-term high of $120,000.
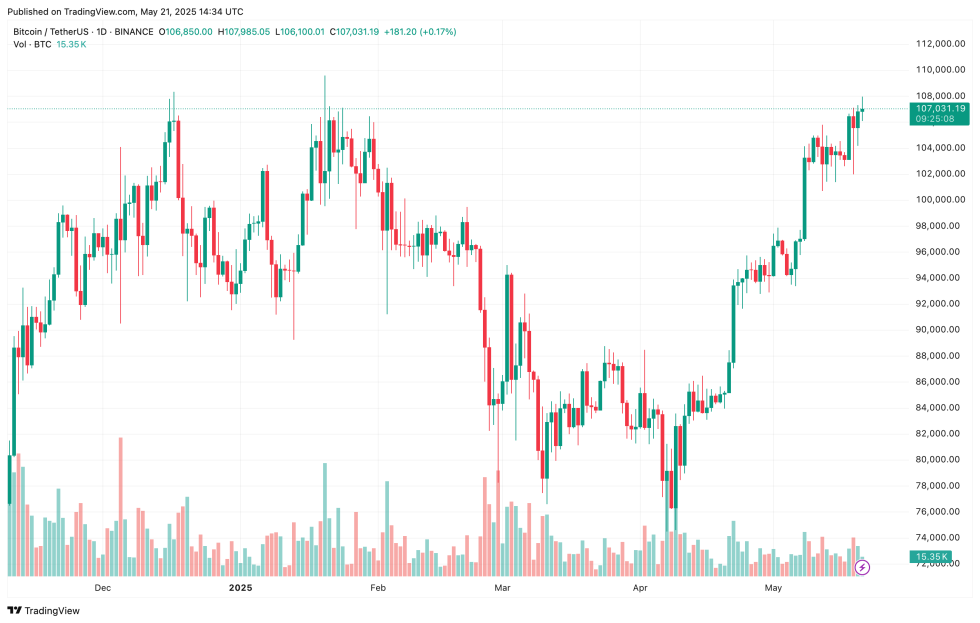
Adding to the bullish sentiment, BTC continues to flow out of exchanges at a notable pace. Over 100,000 BTC have been withdrawn within the past three weeks, signalling that investors may be positioning for further upside. At press time, BTC trades at $107,031, up 2.5% in the past 24 hours.
Featured Image from Unsplash.com, charts from X and TradingView.com

Editorial Process for bitcoinist is centered on delivering thoroughly researched, accurate, and unbiased content. We uphold strict sourcing standards, and each page undergoes diligent review by our team of top technology experts and seasoned editors. This process ensures the integrity, relevance, and value of our content for our readers.

