Reason to trust
Strict editorial policy that focuses on accuracy, relevance, and impartiality
Created by industry experts and meticulously reviewed
The highest standards in reporting and publishing
Strict editorial policy that focuses on accuracy, relevance, and impartiality
Morbi pretium leo et nisl aliquam mollis. Quisque arcu lorem, ultricies quis pellentesque nec, ullamcorper eu odio.
The daily Dogecoin/USDT chart published on X by Bitcoinsensus depicts the memecoin locked in a textbook bullish reversal that has been six months in the making.
Dogecoin Breakout Within 7 Days?
Price action stretching from last October’s vertical rally to the present has carved a broad descending trend line that caps every major swing-high: first the December spike just above $0.48, then a second, lower reaction high in mid-January around $0.43 and a third touch 10 days ago at roughly $0.26. That trend-line is still intact, but—crucially—it now sits only a few percentage points above the market.
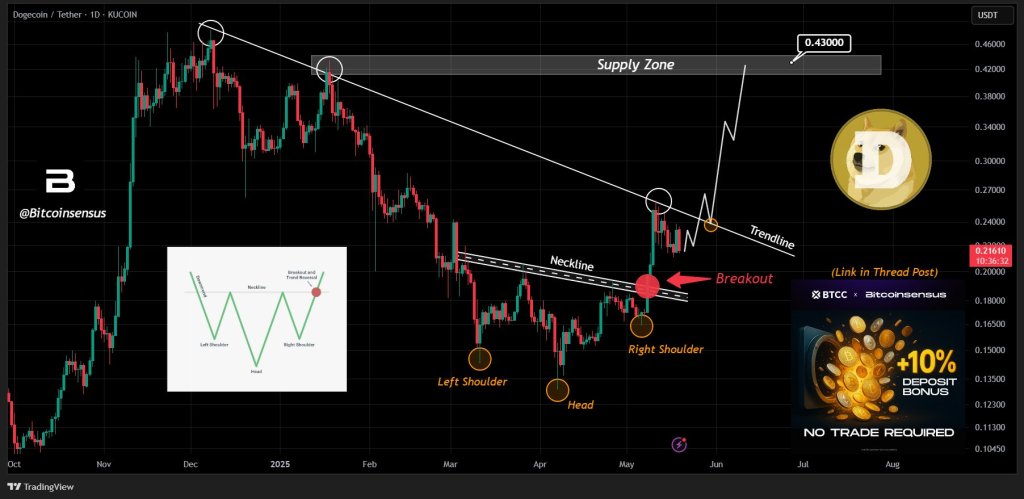
Within that larger down-trend, Bitcoinsensus highlights an inverted head-and-shoulders pattern whose left shoulder bottomed near $0.142 in mid-March, whose head extended to roughly$0.141 at the start of April, and whose right shoulder formed in early May at about $0.164. The neckline of that structure is not horizontal; it falls modestly from left to right and intersects the chart marginally above $0.185. The analyst marks the 8 May daily candle with a red circle labelled “Breakout,” signalling that the minimum technical requirement for pattern confirmation has already been met.
Related Reading
Since that breakout, Dogecoin has retraced in what the analyst calls a healthy manner. The pull-back has so far respected the neckline, transforming it from resistance into first-layer support. Bitcoinsensus’ projected path, drawn in white, envisages one further dip that tags the long-term trend-line—now lurking near the $0.23–0.24 area—before momentum reverses upward. The forecast gives the market a seven-day window to complete that retest and launch a fresh advance.
“Dogecoin has been slightly pulling back in a very healthy manner, preparing for the next major breakout. The anticipated breakout is expected to happen within the next 7 days, with a retest of the trendline for confirmation,” the analyst writes.
Related Reading
If the trend-line gives way, the next test would be a grey “Supply Zone” boxed between $0.42 and $0.43, an area that coincides with the January distribution range and the second anchor point of the descending trend-line. “Next Target will be the supply zone at around $0.42-$0.43 per DOGE. Expect a fast move up once the breakout is in full force,” the analyst adds.
A decisive daily close inside that band would, in classical chart-theory terms, establish the first higher-high on a major timeframe since November and open the door to a broader trend reversal.
Invalidation remains straightforward. A daily settlement back below the neckline—effectively the $0.185 handle—would negate the inverted head-and-shoulders structure and leave the March/April lows vulnerable. Until then, the technical bias skews higher, and the clock on Bitcoinsensus’ seven-day breakout thesis is ticking.
At press time, DOGE traded at $0.221.
Featured image created with DALL.E, chart from TradingView.com

