Reason to trust
Strict editorial policy that focuses on accuracy, relevance, and impartiality
Created by industry experts and meticulously reviewed
The highest standards in reporting and publishing
Strict editorial policy that focuses on accuracy, relevance, and impartiality
Morbi pretium leo et nisl aliquam mollis. Quisque arcu lorem, ultricies quis pellentesque nec, ullamcorper eu odio.
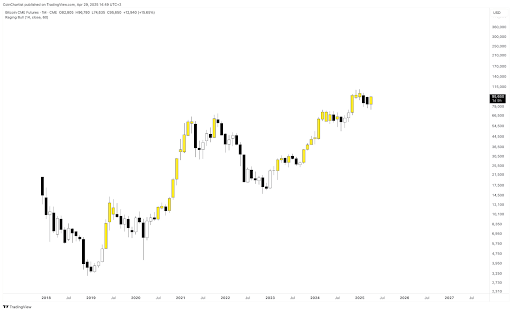
Bitcoin continues to show signs of resilience at the $95,000 region, pushing higher from recent lows and attempting to reclaim its bullish structure after a volatile April. The monthly candlestick for April on the CME Futures chart currently presents a strong bullish engulfing formation, which, if sustained into the weekly close, could provide the market with bullish momentum to close May with another bullish candle.
The potential of this bullish close is enough to sway the sentiment among bearish proponents, according to crypto analyst Tony “The Bull” Severino.
Raging Bull Tool Flashes Signal On CME Futures
Bitcoin’s price action over the past two weeks has been positive and has seen an otherwise waning bullish sentiment slowly creeping back among crypto traders. Interestingly, this price action has even seen Bitcoin’s net taker volume turn positive for the first time in a while. Although the trend is still in its early stages, the renewed strength is already beginning to soften some of the more bearish outlooks, especially as key indicators start to turn.
Related Reading
Tony “The Bull” Severino, a well-followed crypto analyst, recently revealed on social media platform X that his proprietary “Raging Bull” indicator has turned back on. However, this indicator has turned back on only on the Bitcoin CME Futures chart, not the spot BTC/USD chart.

The divergence between CME Futures and the spot chart, with only the former flashing this bullish signal, has added complexity to Bitcoin’s current outlook. The Raging Bull tool, which uses weekly price data, is designed to identify early stages of powerful upward movements. According to Severino, the appearance of this signal, despite his bearish stance, suggests a meaningful shift in market structure may be developing. However, he was quick to add that a confirmed weekly close is still necessary before any firm conclusions can be drawn.
Breaking Above This Level Is Key
Examining the monthly chart shared by the analyst, the bullish engulfing candlestick is clearly visible following a sharp rebound from April’s lows below $83,000. Bitcoin began the month of April at around $83,000, but a swift downturn in the first few days pushed the price downward until it bottomed out at around $75,000. However, the current April candle not only erases March’s losses but also indicates increased interest in Bitcoin from institutional traders on the CME platform.
Related Reading
Still, despite the encouraging candlestick formation, Bitcoin must decisively break above the $96,000 to $100,000 region, where previous uptrends have stalled. This level is acting as a ceiling that could determine whether the recent bullish momentum continues or stalls. A failure to close above this range, either on the weekly or monthly timeframe, could invalidate the Raging Bull signal.
Additionally, the Raging Bull indicator needs to turn back on the spot BTCUSD chart to confirm a strong bullish outlook. This can only be done if Bitcoin manages to break substantially above $96,000.
At the time of writing, Bitcoin is trading at $94,934.
Featured image from Pixabay, chart from Tradingview.com


