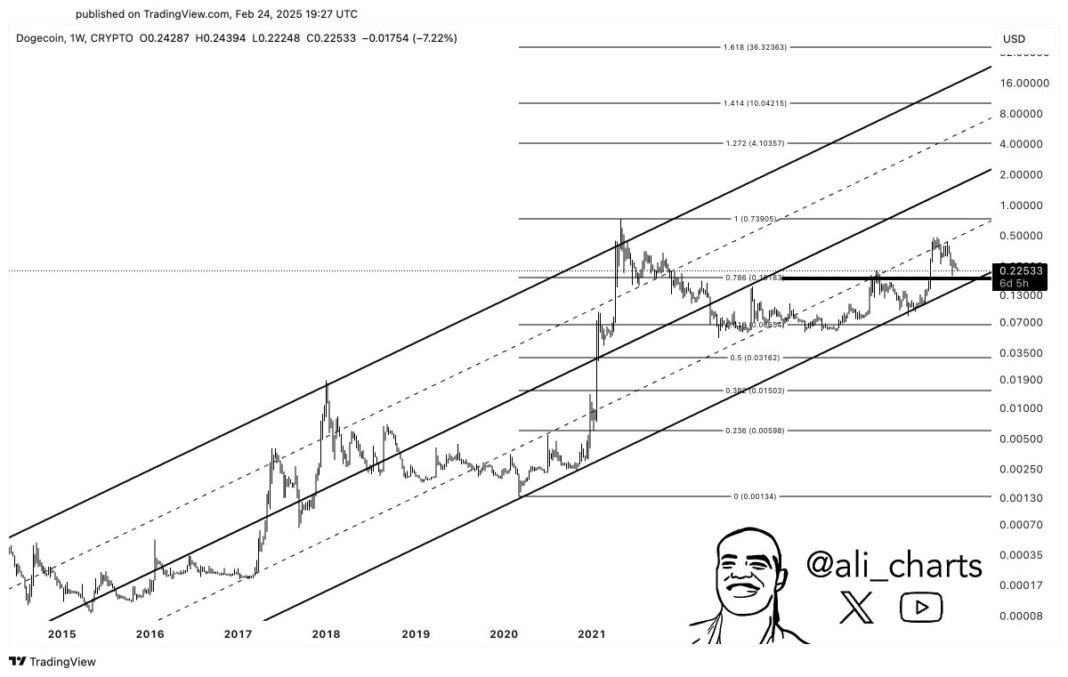
In a post on X on Tuesday, crypto analyst Ali Martinez (@ali_charts) shared a long‐term Dogecoin (DOGE) price chart highlighting a critical support level that, if lost, could open the door for a steep correction. Martinez pinpointed $0.19 as the line in the sand. Should the meme‐inspired token dip below this threshold, he argues, “the probability of a deeper correction toward $0.06 significantly increases.”
Dogecoin Crash To $0.06 Incoming?
The weekly chart—which spans back to early 2014—depicts Dogecoin trading within a broad ascending channel. Solid black trend lines enclose most of the price action from DOGE’s earliest sub‐penny valuations to the all‐time high of roughly $0.73 in 2021. Dashed lines running parallel to these trend lines appear to act as mid‐channel guides, capturing smaller swings within Dogecoin’s larger market cycles.
Notably, DOGE has spent prolonged periods moving laterally within the lower range of this channel, only to break out sharply when it has tested the upper boundaries. When Martinez posted the chart, Dogecoin was seen hovering around $0.225, just above a key horizontal support region in the chart.
Related Reading
Overlaid on the channel are extensive Fibonacci levels derived from Dogecoin’s long‐term price history. The 0.786 Fib retracement—commonly viewed as a make‐or‐break support in deeper corrections—seems to align near $0.1978, very close to the $0.19 level Martinez highlighted.
Below $0.19, the chart shows few immediate technical cushions until roughly $0.13, which is aligning with the lower part of the multi‐year ascending channel. Beneath that, the $0.06 price point emerges as the most prominent downside target, potentially matching a key historical congestion area and aligning with the lower part of the multi‐year ascending channel.
Among the other Fibonacci levels visible on the chart are the 0.618 Fib near $0.05, 0.5 Fib near $0.03, 0.382 Fib near $0.015 and 0.236 Fib near $0.0059. While these lower Fib lines may not all come into play, they help map out DOGE’s historical support/resistance zones in the event of an extended sell‐off.
Related Reading
The chart also shows higher Fib extension levels such as 1.272 (around $4.10), 1.414 (around $10.04), and 1.618 (around $36.32). Though these may appear far‐fetched given current market conditions, such extensions on a long‐term chart can serve as reference points if Dogecoin were to regain strong bullish momentum and climb toward new heights in future market cycles.
For now, all eyes are on $0.19 as Dogecoin’s crucial inflection point. If DOGE holds above this level, it may preserve its place in the mid‐range of the ascending channel. However, as Ali Martinez warns, a breach of $0.19 could intensify downward pressure and potentially set Dogecoin on a path toward $0.06.
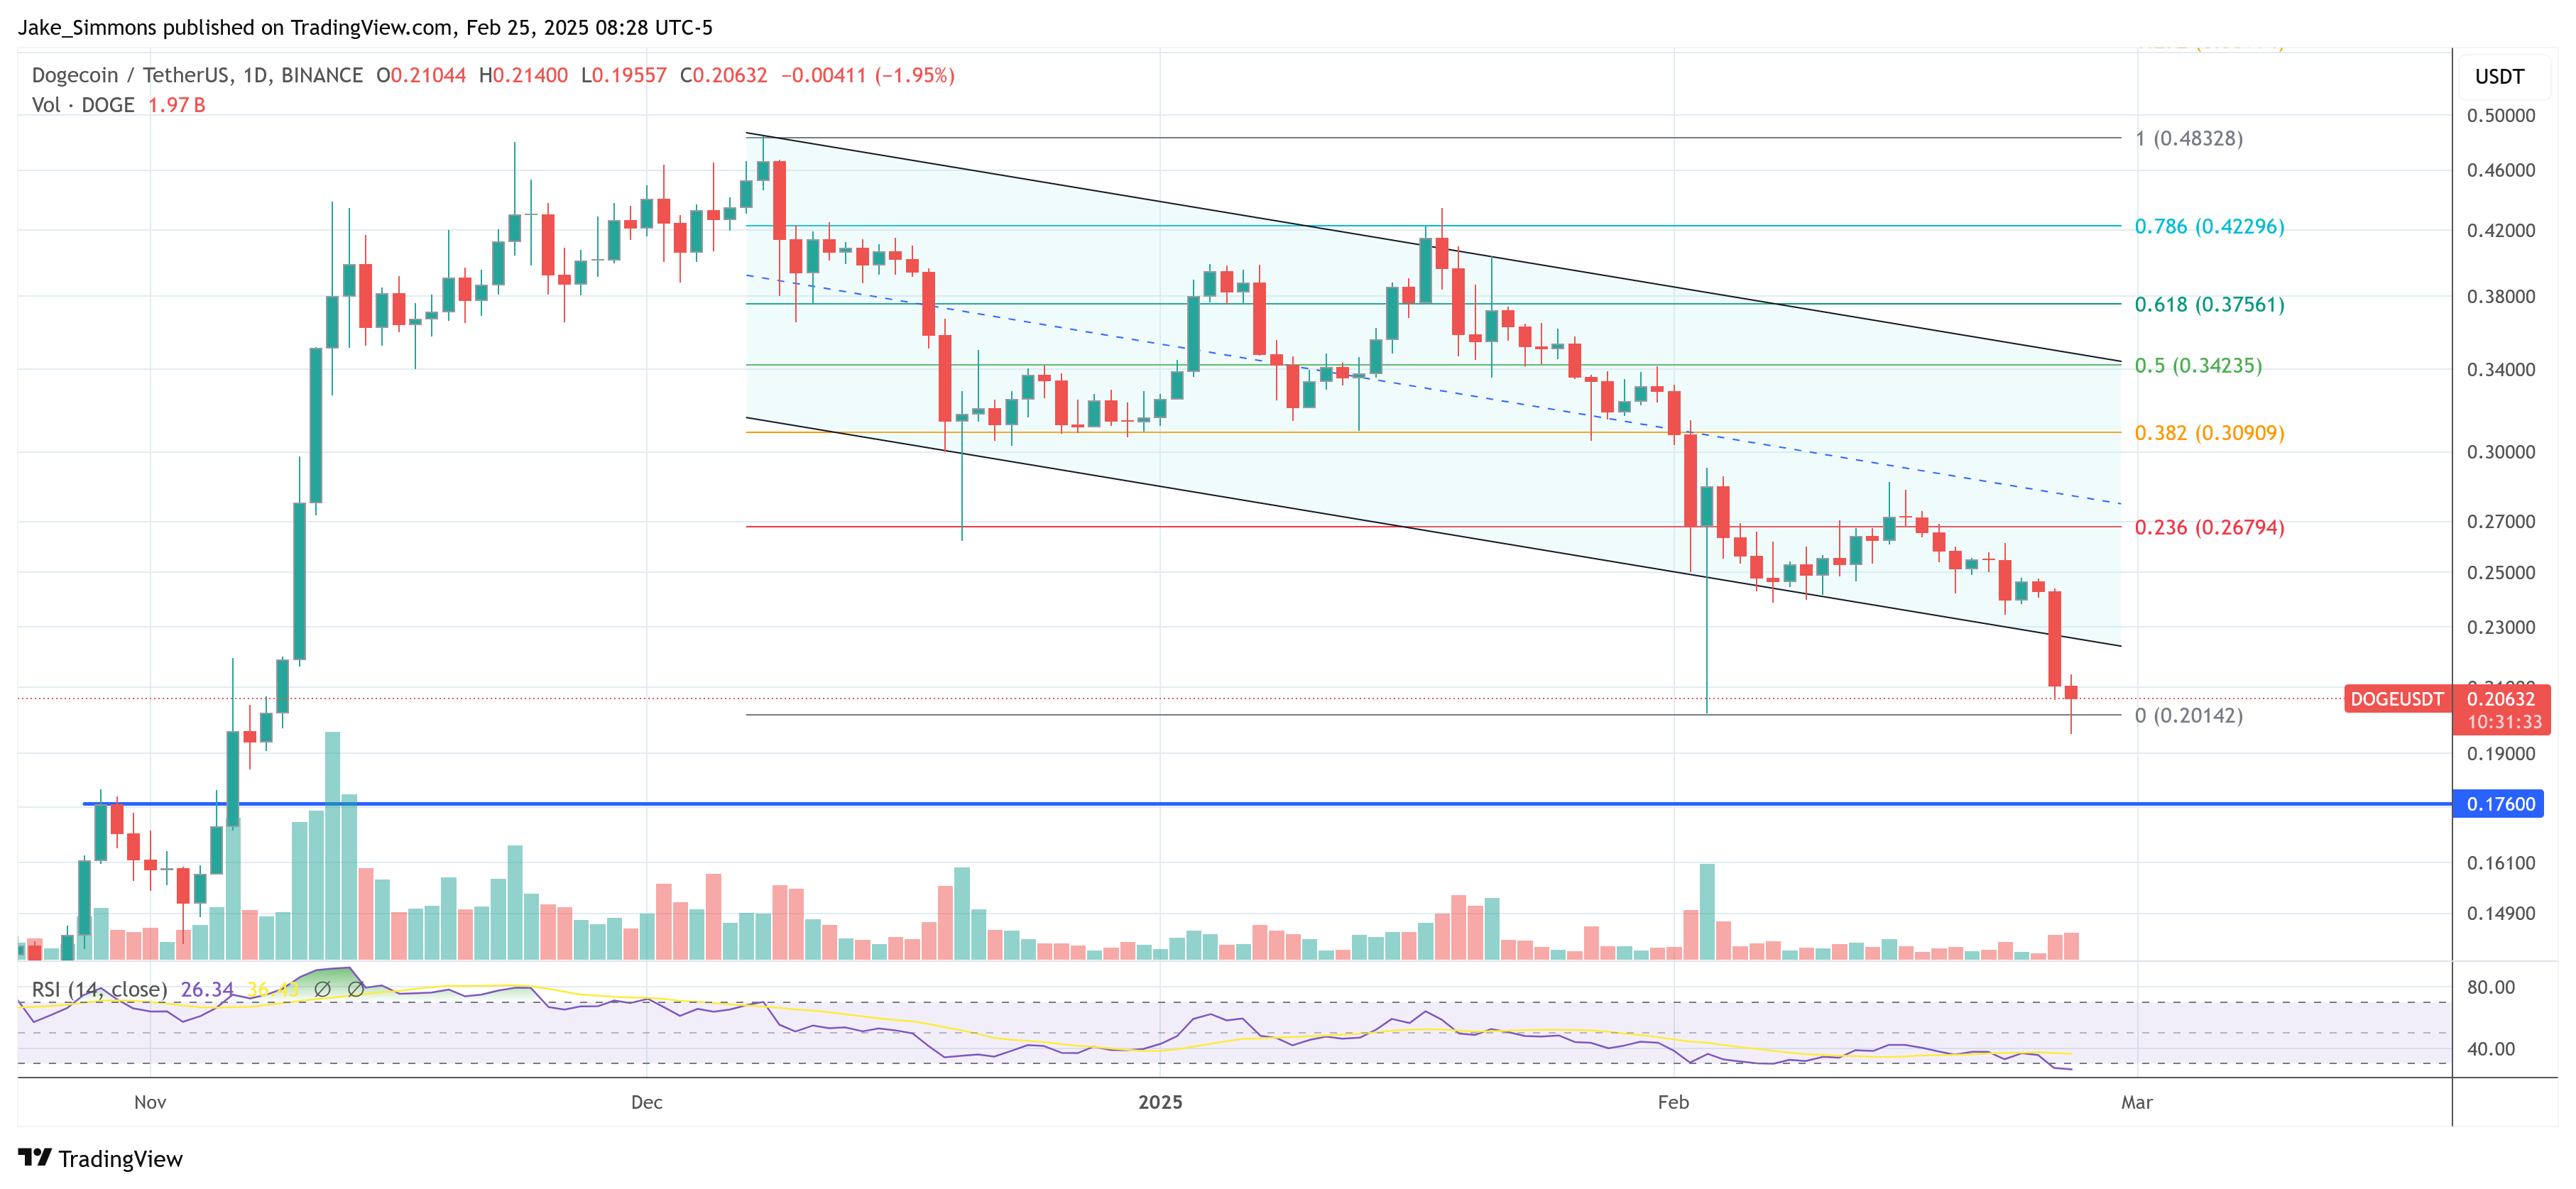
At press time, DOGE traded at $0.206.

Featured image created with DALL.E, chart from TradingView.com

